
Capstone Report: Investigation of Median Age and COVID-19 Percent Mortality in Florida Counties
Introduction
In December 2019, a contagious disease known as Coronavirus disease 2019 (COVID-19) was first identified in Wuhan, China. The virus spread and by March 11, 2020, the World Health Organization declared COVID-19 a worldwide pandemic.
At the beginning of the pandemic, it was consistently noticed there was an age-based pattern in fatality. In South Korea, the average fatality rate was 2.37%, but among those 70-79 and 80+ years old, the mortality rate was 10.9% and 26.6%, respectively. This almost exponential increase was also noticed in different parts of the world such as China, Italy, and the United Kingdom [1]. Within the United States, more than 80% of COVID-19 mortality comes from those 65 years and older [4]. This suggests that age may be an important factor in COVID-19 mortality.
In the United States, Florida ranks third in cases and fourth in deaths. Across its 67 counties and at the time of this report, it has nearly 1.9 million cases as well as over 30,000 deaths.
The motivation for this report comes from the percent mortality in these Florida counties. This mortality varies greatly, ranging from 0.4% to 4.2%. We assume that the underlying reason behind this is age.
In this investigation, we will look at age and mortality characteristics of reported Florida COVID-19 cases. We will also apply statistical methods to analyze the relationship between age and percent mortality.
The objective of this study is to explore the relationship between Median Age and COVID 19 Percent Mortality in Florida counties. The study will also determine the significance of the relationship between the two.
Methods
Data Source
The data came from the Florida Department of Health Open Data [2]. The data contained all reported individual level COVID-19 cases in Florida. It includes aspects such as which county the case was found, the age and gender of the case, whether or not the case has died, and when they were confirmed a case.
At the time of this report, the data contained all Florida COVID-19 cases up to January 13th.
Data Characteristics
Several manipulations of the data were used to calculate median age and percent mortality with in the data set. To calculate the median age, the data was aggregated by county and then median age was calculated. As for percent mortality, data was filtered to only contain cases that were reported to have died. Then the summation of these deaths were grouped by county. This was compared to the total amount of cases in each county, and percent mortality could be calculated.
Two aspects of the data were categorized: age group and mortality group. Age group was defined as as “younger” or “older”. Counties in the “younger” age group were those that have a median age of less than or equal to 43, and “older” were otherwise. Mortality group was defined as “lower” or “higher”. Counties in the “lower” mortality group were those that have a percent mortality of less than or equal to 1.6%, and “higher” were otherwise. 43 years old and 1.6% mortality were both considered cutoffs since they are the medians in their respective groups.
Another perspective related to mortality is infection fatality ratio (IFR), which is defined as the proportion of people infected with the virus, including those who did not get tested or show symptoms, who will die as a result [3]. The IFR was calculated within age groups provided by the data set.
Graphical Analysis
Different aspects of the data were investigated: 1) a spaghetti plot of weekly median age of COVID-19 cases in Florida Counties, 2) overall trend of median age and percent mortality, 3) a boxplot of percent mortality by age group, and 4) a boxplot of median age by mortality group.
Linear Regression
Two linear regressions were first used to see the relationship between percent mortality and median age. One model used age was a continuous variable and the other as a categorical variable. Doing a Shapiro-Wilks test and looking at the histogram showed that the distribution of the percent mortality is not normal (Figure 1). Thus, a log transformation was used to normalize the distribution of percent mortality.
Logistic Regression
Two logistic regressions were performed using newly created binary outcome “mortality group” (low vs high), median age as a continuous variable, and median age in terms of age group (young vs old).
Results
Data Characteristics
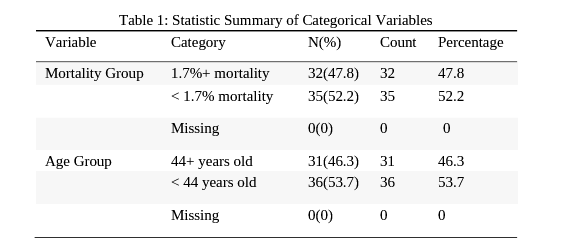
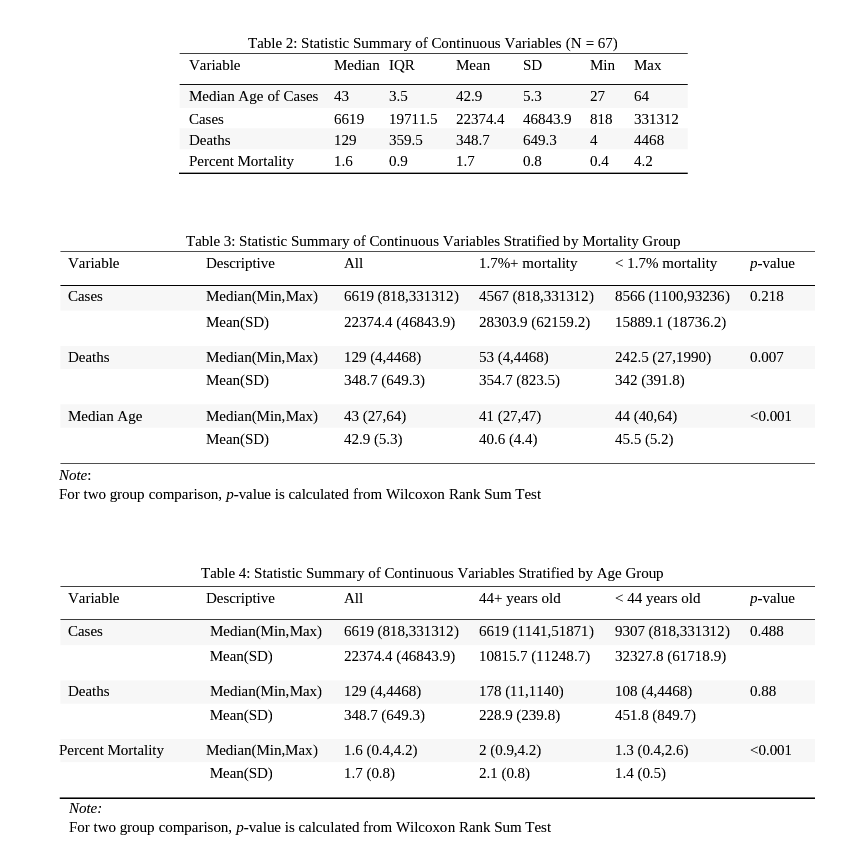
Data characteristics involved observing median age, number of cases, number of deaths, and the percent mortality in Florida counties. Among median age of COVID-19 cases, the mean and median are almost the same value 43 years old. The cases vary widely. The average amount of cases in a Florida county is 23374, but a median of 6619. This suggests that the mean is being pulled towards the right, since the largest number of cases is 331312 cases in Dade County, compared to the smallest, which is 818 cases in Glades. Deaths follow the same pattern: the mean is 349 versus the median of 129 deaths. The least number of deaths was in Franklin County, while most came from Dade County. Percent mortality has a mean and median of 1.7% and 1.6%, respectively (Table 1). Interestingly, while Dade County has the greatest number of deaths, Union County has the highest percent mortality of 4.2%.
When categorizing mortality and age into groups (Table 2), there are 32 counties that have higher mortality and 31 counties with higher median age, whereas there are 36 counties with lower mortality and 35 with lower median age. When stratifying the data by these groups, we see using the Wilcoxon Rank Sum test produces a significant p-values when comparing median age in mortality group and percent mortality in age group.

Histogram of Percent Mortality and Age
Graphical Analysis
As shown in Figure 2, there is a temporal trend of median age of COVID-19 cases across all Florida counties. From spring to summer, the median age slowly decreased over time. However, in the fall and winter, the median age began to rise again. There seems to be a positive trend in percent mortality by median age (Figure 3). This suggests that median age has a positive association with percent mortality.
We have similar findings in both boxplots as well. The “older” age group contains more counties with higher percent mortality, the opposite is true for the “younger” age group (Figure 4). Similarly, the “higher” mortality group contains counties with a higher median age, as the “lower” mortality group contains those with lower median age (Figure 4).
The IFR rate (Figure 5) grows exponentially as the age group increases. For those in ages between 0 and 44, the fatality ratio is less than 2 deaths per 1,000 cases. However, after that the fatality ratio starts to move swiftly. This is true with the final two age groups 65-74 and 75-84. Those in the former group have a IFR of 39.7 deaths per 1,000 cases, and it jumps to 100.2 deaths per 1,000 cases in the latter age group.
Thus, the graphical analysis shows evidence of age groups being positively associated with higher fatality ratios.

Spaghetti Plot of Weekly Median Age of COVID-19 Cases in FL Counties

Plot of Percent Mortality by Median Age

Boxplots

Infection Fatality Ratio Among Age Groups
Linear Regression
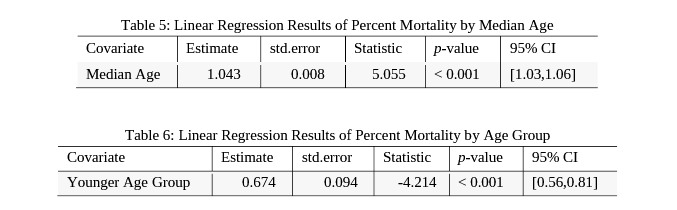
In the linear regression (Table 5) with percent mortality as the response and median age as the predictor, the coefficient of median age is 0.04. Since the response is log-transformed, the coefficient is exponentiated to give a value of 1.04, with a 95% CI (1.03, 1.06). This means that for every increase in median age, the percent mortality increases by 4%.
Now using age as a categorical variable (Table 6), exponentiated coefficeint for younger age group is 0.68, with a 95% CI (0.56, 0.81) This is interpreted as those in the younger age group will have a 32% lower mean percent mortality than the older age group.
Logistic Regression
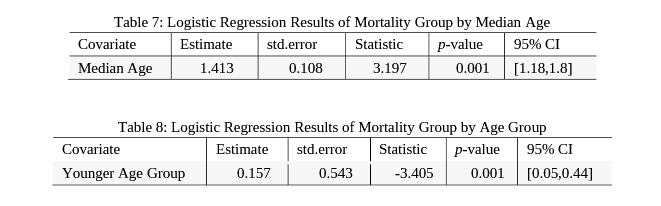
In the logistic regression with mortality group as the response and age as the predictor (Table 7), the coefficient for median age is 0.35. Similar to our linear regression, we have to exponentiate the coefficient for a better interpretation of the model. The exponential of the median age coefficient is 1.41, with a 95% CI (1.18, 1.80). This can be interpreted as for every increase in median age, the odds of being in the higher mortality group increases by 40%.
With age as categorical variable (Table 8), the coefficient is -1.85, which the exponential of our median age coefficient gives us 0.16, with a 95% CI (0.05, 0.44). We can interpret this as being in the younger age group makes odds of being in the higher mortality group 84% less likely.
It can be noted that since the 95% CI in both logistic regression do not contain 1 in their intervals, the coefficient of median age and age group is significant.
Discussion
Through the summary statistics, graphical analysis, linear regressions, and logistic regressions, COVID-19 percent mortality is associated with median age. Using a Wilcoxon rank sum test demonstrated a significant p-value. While we do not suggest using a p-value has proof that there is a significant association, we do believe that this gives us evidence of an association.
In the graphical analysis, there were four main findings. The scatterplot displayed a positive association with age and mortality. The boxplots showed that the higher mortality group has higher median ages, while the older group has higher percent mortalities. Looking at the IFR of different age groups, the IFR increases dramatically in older age groups.
With a linear regression of the log-transformed percent mortality, age as a continuous and categorical variable is significant. In both cases, age does not contain 1 in its confidence interval, meaning there is a significant difference when testing at an alpha level of 0.05.
Similarly, the logistic regression with mortality as a categorical variable shows age is significant as both a continuous and categorical variable. With 1 not contained in the confidence intervals, the results are significant.
In our investigation of COVID-19 percent mortality across all Florida counties, we have evidence that the mortality is associated with median age.
Acknowledgements
I would like to thank Dr. Ji-Hyun Lee for her guidance. The origin of this investigation came from working with her in the Division of Quantitative Sciences.
I would also like to thank Dr. Jing Zhao for her feedback and supervision. Her help gave me more insight on the report, as well as understanding of the R software and COVID-19 data.
Data analysis was performed using R software, along with the R
packages: tidyverse, lubridate, knitr, ggpubr, hablar,
kableExtra, and gridExtra.
References
[1] Kang, Seung Ji, and Sook In Jung. “Age-Related Morbidity and Mortality among Patients with COVID-19.” Infection & chemotherapy vol. 52,2 (2020): 154-164. doi:10.3947/ic.2020.52.2.154
[2] Florida COVID19 Case Line Data. Florida Department of Health Open Data Content. Web. 2021 Jan. 13.
[3] Mallapaty, Smriti. “The Coronavirus Is Most Deadly If You Are Older and Male - New Data Reveal the Risks.” Nature News. Nature Publishing Group, 28 Aug. 2020. Web. 01 Mar. 2021.
[4] “COVID-19 Provisional Counts - Weekly Updates by Select Demographic and Geographic Characteristics.” Centers for Disease Control and Prevention. Web. 01 Mar. 2021.